
1. Introduction to HRV Data Analysis
Heart rate variability (HRV) represents a non-invasive measure of the autonomic nervous system’s function and is increasingly recognized for its critical role in health research. By analyzing variations in the time interval between heartbeats, HRV provides insights into physiological processes that are otherwise difficult to detect. This method has become a fundamental tool in a variety of fields including cardiology, psychiatry, sleep research, and sports science, where it is used to assess stress, cardiac health, emotional responses, and recovery status.
“HRV measures offer vital insights into heart health and stress, proving essential across health research and personalized medicine.”
The analysis of HRV data is intricate, requiring precise measurement and sophisticated analytical techniques to derive meaningful interpretations. This article aims to explore the different variables that can be calculated from HRV data, explain the methodologies behind these calculations, and discuss what these variables indicate about physiological and psychological states.
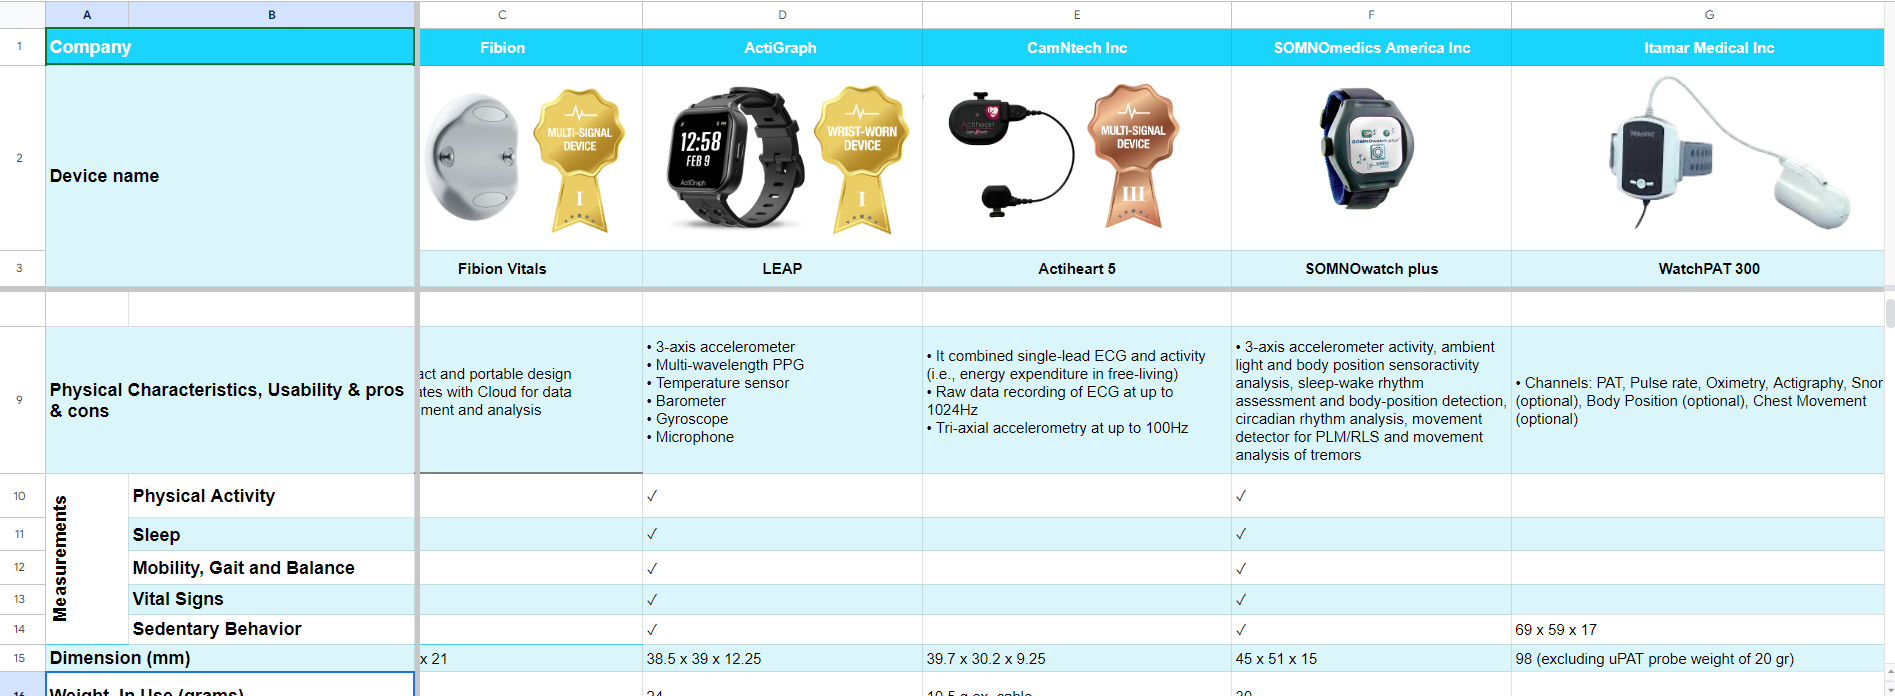
Download the Actigraphy with Heart Rate Comparison Sheet
Understanding HRV data analysis is not just about calculating various metrics; it involves comprehending what each metric reveals about autonomic nervous system activity and overall health. As HRV research continues to evolve, it offers profound implications for preventative medicine, tailored therapies, and personalized health strategies, making the mastery of its data analysis techniques essential for researchers and practitioners alike.
2. Fundamentals of HRV Measurement
Before diving into the specifics of heart rate variability (HRV) data analysis, it’s crucial to understand the foundational aspects of how HRV data is collected. The accuracy of HRV analysis heavily relies on the quality of data acquisition, which is influenced by the measurement techniques and the devices used.
“Understanding HRV starts with precise data collection using ECGs for clinical accuracy, PPGs for wearable convenience, and chest straps for sports research balance.”

2.1. Types of Sensors and Devices Commonly Used for HRV Data Acquisition
HRV measurement can be performed using various types of sensors and devices, each with its own set of advantages and limitations:
- Electrocardiographs (ECGs): ECGs are the gold standard for HRV data collection. They measure the electrical activity of the heart using electrodes placed on the skin, providing highly accurate and detailed information about the heart’s behavior. ECGs are ideal for clinical settings where precision is paramount.
- Photoplethysmographs (PPGs): PPGs are commonly found in wearable devices like fitness trackers and smartwatches. They use light-based technology to detect blood volume changes in the microvascular bed of tissue. While PPGs are more convenient and accessible for continuous monitoring, they may offer less accuracy compared to ECGs, especially under conditions of intense physical activity or when the device loses contact with the skin.
- Chest Straps: Often used in sports and exercise research, chest straps measure heart rate using electrical sensors. They are favored for their balance between accuracy and convenience, particularly in dynamic and outdoor research settings.

2.2. Key HRV Metrics and Their Calculations
HRV analysis primarily focuses on the time intervals between consecutive heartbeats, known as inter-beat intervals (IBIs). From these intervals, several time-domain, frequency-domain, and non-linear metrics can be derived:
Time-Domain Measures
- RR Intervals and NN Intervals: These are the intervals between consecutive heartbeats measured in milliseconds. RR intervals are all intervals between heartbeats, while NN intervals specifically denote normal-to-normal heartbeats, excluding arrhythmic beats.
- Standard Deviation of NN Intervals (SDNN): This is the standard deviation of NN intervals. It reflects all the cyclic components responsible for variability in the period of recording and provides an index of overall HRV.
- Root Mean Square of Successive Differences (RMSSD): This measure calculates the square root of the mean of the squares of the successive differences between adjacent NNs. RMSSD is a good indicator of short-term components of HRV and is particularly sensitive to changes in parasympathetic nervous system activity.
Frequency-Domain Measures
- Power Spectral Density Analysis: This method analyzes the frequency components of HRV. It typically separates the spectrum into different bands:
- Low Frequency (LF): Ranges from 0.04 to 0.15 Hz and reflects both sympathetic and parasympathetic activity.
- High Frequency (HF): Ranges from 0.15 to 0.40 Hz and is mainly indicative of parasympathetic activity.
- LF/HF Ratio: This ratio is used to assess the balance between sympathetic and parasympathetic influences.
Non-linear Measures
- Poincaré Plot: This plot is a scatterplot of the current NN interval against the next NN interval. It helps visualize the pattern of heartbeats to identify irregularities.
- Entropy Measures: These are statistical measures that quantify the irregularity and complexity of HRV, providing insights into the physiological mechanisms affecting heart rate dynamics.
Understanding these measurements and their implications allows researchers to employ HRV data analysis effectively in their studies, drawing reliable conclusions about autonomic nervous system function and overall health.
3. Applications of HRV Data Analysis
Heart rate variability (HRV) data analysis is not just a tool for academic inquiry but also a practical resource in clinical diagnostics, sports science, and psychological stress and recovery research. The versatility of HRV as a measure of autonomic nervous system activity makes it invaluable in a wide range of applications:
3.1. Clinical Diagnostics
In clinical settings, HRV analysis is used to assess cardiac health and predict potential cardiovascular issues. Decreased HRV can be an indicator of poor heart health and a higher risk of cardiac events. It is used in the management of various conditions such as:
- Heart Disease: Monitoring HRV helps in identifying patients at risk of arrhythmias and other heart-related complications.
- Diabetes: Changes in HRV can indicate autonomic neuropathy, a common complication of diabetes, which affects the nerves that control the heart and blood vessels.
- Depression and Anxiety: HRV is used to assess the impact of psychological states on cardiac function, where lower HRV is often associated with higher stress and anxiety levels.

3.2. Sports Science and Athlete Management
HRV is a critical tool in sports science, used to optimize training and recovery programs for athletes. By monitoring HRV, coaches and sports scientists can gauge an athlete’s response to training loads and make informed decisions about when to intensify or ease training to prevent overtraining and facilitate recovery:
- Training Load Management: HRV provides insights into an athlete’s physiological readiness to perform, helping in tailoring training programs that maximize performance while minimizing the risk of injury.
- Recovery Assessment: After intense training sessions or competitions, HRV measurements can help determine how well an athlete is recovering and when they are ready to resume high-intensity training.
3.3. Understanding Stress and Recovery in Psychological Studies
HRV is extensively used in psychological research to study stress, emotional regulation, and recovery. The variability in heart rate serves as a proxy for the body’s ability to efficiently manage stress through autonomic processes:
- Stress Response Evaluation: Higher HRV typically indicates better stress management and greater resilience to psychological stressors.
- Effectiveness of Therapeutic Interventions: HRV is used to evaluate the impact of various therapeutic interventions like mindfulness, biofeedback, and cognitive-behavioral therapy on autonomic regulation.

3.4. Advanced Analytical Techniques in HRV Research
The field of HRV research continuously evolves with technological advancements that improve data collection and analysis. Modern analytical techniques, including machine learning and complex algorithmic modeling, are being integrated into HRV analysis to enhance the precision and predictive power of HRV metrics:
- Machine Learning Models: These models can analyze large datasets of HRV metrics to identify patterns and predict health outcomes with high accuracy.
- Real-Time HRV Analysis: With advancements in wearable technology, real-time HRV analysis is becoming feasible, providing immediate feedback that can be used for adjusting training protocols or stress management strategies instantly.
HRV data analysis offers a profound insight into the interplay between physiological and psychological health factors. By understanding these applications, researchers and practitioners can utilize HRV to its full potential, fostering better health outcomes across diverse fields. The next section will explore some of the challenges encountered in HRV data analysis and strategies to overcome them, ensuring robust and actionable findings.

4. Challenges in HRV Data Analysis
Despite the valuable insights HRV data can provide, researchers often face several challenges in its analysis. These obstacles can impact the accuracy of findings and the effectiveness of using HRV as a diagnostic or monitoring tool. Addressing these challenges is crucial for deriving reliable and meaningful conclusions from HRV data.
4.1. Common Pitfalls in Data Collection and Analysis
- Signal Artifacts and Noise: HRV data is susceptible to interference from external factors such as movement artifacts, electrical noise, or incorrect sensor placement. These can lead to inaccurate readings, skewing data interpretation.
- Short Measurement Periods: For frequency-domain and non-linear HRV metrics, the length of the data recording significantly influences the results. Too short a measurement period may not provide a representative sample of heart rate variability, leading to misleading conclusions.
- Inconsistent Methodologies: Variations in how HRV data is collected, processed, and analyzed can lead to inconsistencies between studies, making it difficult to compare results across different research.

4.2. Strategies to Overcome HRV Data Analysis Challenges
- Standardization of Procedures: Implementing standardized protocols for data collection, including fixed times for measurements and uniform equipment usage, can help minimize variability in HRV data due to methodological differences.
- Enhanced Data Filtering Techniques: Employing advanced signal processing techniques to filter out noise and correct artifacts in HRV data ensures higher data fidelity. Tools like wavelet transforms and advanced spectral analysis can isolate the true signals from noise.
- Longer Monitoring Periods: Extending the duration of HRV monitoring can provide a more accurate and comprehensive view of heart rate dynamics, especially for capturing cyclic components and long-term trends in physiological responses.
- Training and Calibration: Regular training sessions for researchers and participants on the proper use of HRV monitoring equipment can improve data quality. Calibration of devices before each use ensures consistent performance and accuracy.
- Leveraging Advanced Analytics: Applying machine learning and data analytics tools can help in identifying and correcting anomalies in HRV data, as well as in extracting more nuanced insights from complex datasets.

4.3. Future Directions in HRV Data Analysis
The ongoing advancements in wearable technology, data analytics, and artificial intelligence hold the potential to revolutionize HRV data analysis. Real-time analytics, enhanced predictive models, and personalized health monitoring are just a few areas where HRV research is expected to make significant strides. These innovations will not only address current challenges but also expand the applications of HRV analysis in new and exciting directions.
By understanding and addressing these challenges, researchers can enhance the reliability and applicability of HRV as a tool for investigating a wide range of physiological and psychological conditions. The next section will conclude the article by summarizing the importance of HRV data analysis and reiterating its role in advancing health research.
5. Conclusion
Heart rate variability (HRV) analysis stands as a potent tool in both the research and clinical environments, offering a window into the autonomic nervous system’s intricacies. Its capacity to reflect the physiological responses to stress, health conditions, and various external stimuli makes HRV a valuable index for assessing wellness and disease.
As this guide has illustrated, HRV data analysis can profoundly impact fields ranging from clinical diagnostics and sports science to psychological research. The ability to quantify and interpret the variations in heart rate offers a unique opportunity to understand better and manage health outcomes effectively. However, as with any scientific tool, the quality of the insights derived from HRV depends significantly on the precision of the data collection, the accuracy of the analysis, and the interpretation of the results.
6. Further Reading and Resources
For those interested in expanding their knowledge on heart rate variability (HRV) and diving deeper into specific methodologies and applications, a wealth of resources is available. Here are several key articles and resources from our website that can provide additional insights into HRV data analysis and its practical applications:
- Understanding Heart Rate Variability: A Comprehensive Guide: This foundational article offers an extensive overview of HRV, discussing its physiological basis and the implications for health and disease research. It’s a great starting point for those new to HRV.
- The Role of HRV in Sports Science: A Game-Changer for Athletes: Learn about how HRV is applied in sports science to optimize athlete training and recovery, emphasizing the use of HRV to monitor physiological readiness and prevent overtraining.
- HRV and Cardiology: A Vital Tool for Heart Health: This article discusses the critical role of HRV monitoring in cardiology, detailing how HRV metrics are used to assess and manage cardiovascular conditions.
- Unraveling the Intricacies of HRV Measurement Techniques: This article covers the latest advancements in HRV measurement technologies, including new devices and methodologies that are pushing the boundaries of what’s possible in HRV research.
You Might Also Be Interested
- 📚 Delve into our comprehensive HRV Article Collection for insightful perspectives on Heart Rate Variability (HRV).
- 🔍 Learn how the advanced features of Fibion Emfit & Fibion Vital can aid you in your HRV research.
- 📅 Planning an HRV measurement and analysis? For a chat with our HRV expert, book a session with Dr. Miriam Cabrita.
Frequently Asked Questions about HRV Data Analysis Research:
What is Heart Rate Variability (HRV) and why is it significant in health research?
Heart Rate Variability (HRV) is the measure of variations in the time interval between heartbeats, reflecting the autonomic nervous system’s function. It provides insights into physiological and psychological states, making it vital for research in cardiology, psychiatry, and sports science.
What are the primary methods for measuring HRV?
The primary methods for HRV measurement include Electrocardiographs (ECGs), which are the gold standard, and Photoplethysmographs (PPGs), commonly found in wearable devices. Both have distinct advantages in terms of accuracy and convenience.
How do different HRV sensors impact data analysis?
The choice of HRV sensors, such as ECGs or PPGs, affects the accuracy and reliability of data. ECGs offer precise measurements crucial for clinical settings, while PPGs provide ease of use for continuous monitoring but may lack accuracy under certain conditions.
What are the key HRV metrics used in data analysis?
Key HRV metrics include time-domain measures like SDNN and RMSSD, frequency-domain measures such as LF, HF, and LF/HF ratio, and non-linear measures like Poincaré plots, which help assess different aspects of heart rate dynamics and autonomic function.
What challenges are faced in HRV data analysis?
Challenges in HRV data analysis include dealing with signal artifacts, ensuring accurate data capture during physical activity, and managing data from different sensor types. Addressing these issues is crucial for obtaining reliable and meaningful analysis results.
How can HRV data analysis be improved in research?
Improvements in HRV data analysis can be achieved by using advanced analytical techniques such as machine learning to enhance data accuracy, adopting standardized measurement protocols, and employing high-quality sensors to reduce errors and improve data reliability.