


Fibion is an easy-to-use product. Sport instructor
students have been using Fibion with customers as part of their studies and feedback has been positive throughout. Fibion analysis fits especially well for
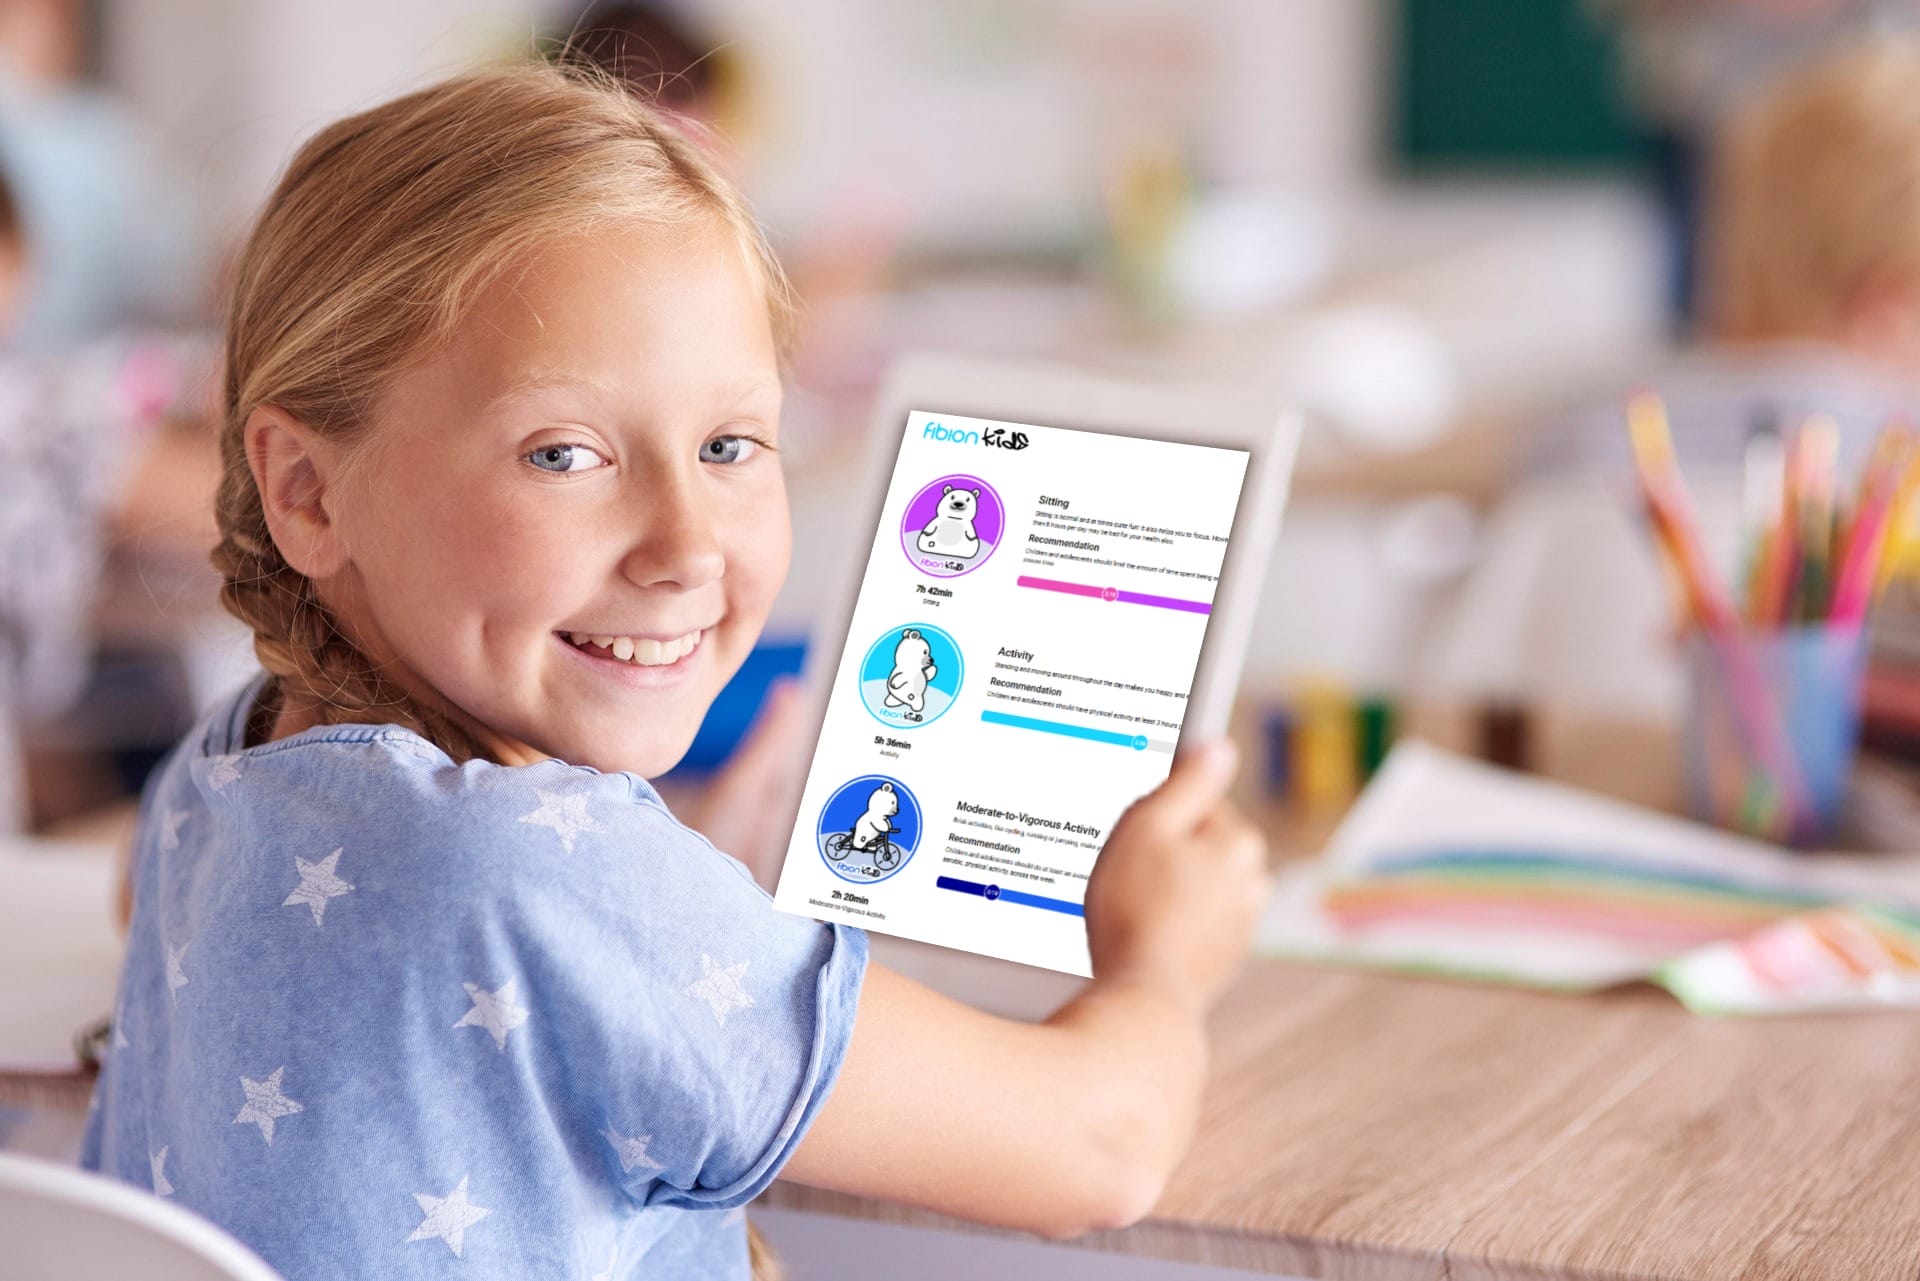
customers that are doing seated work. We have been able to make them realise to have breaks throughout the day and to change their everyday activity routines.

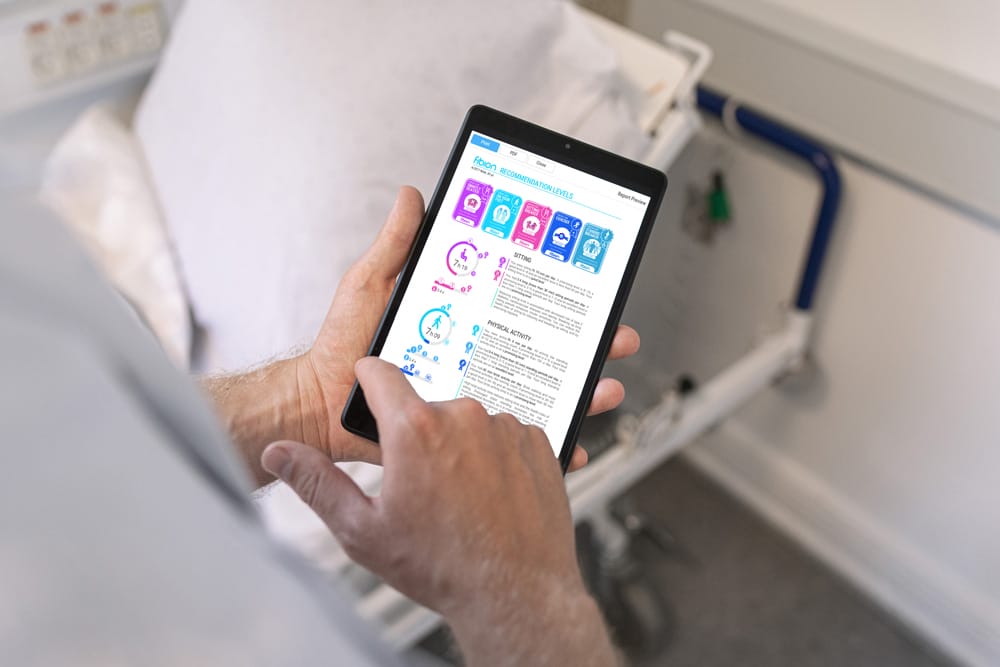
This device has been really useful and the output set you get from the device is easy to read, easy to interpret, and you have really helpful theme you can approach them anytime.

Great tool in lifestyle behaviour change, life management and planning of everyday activity.

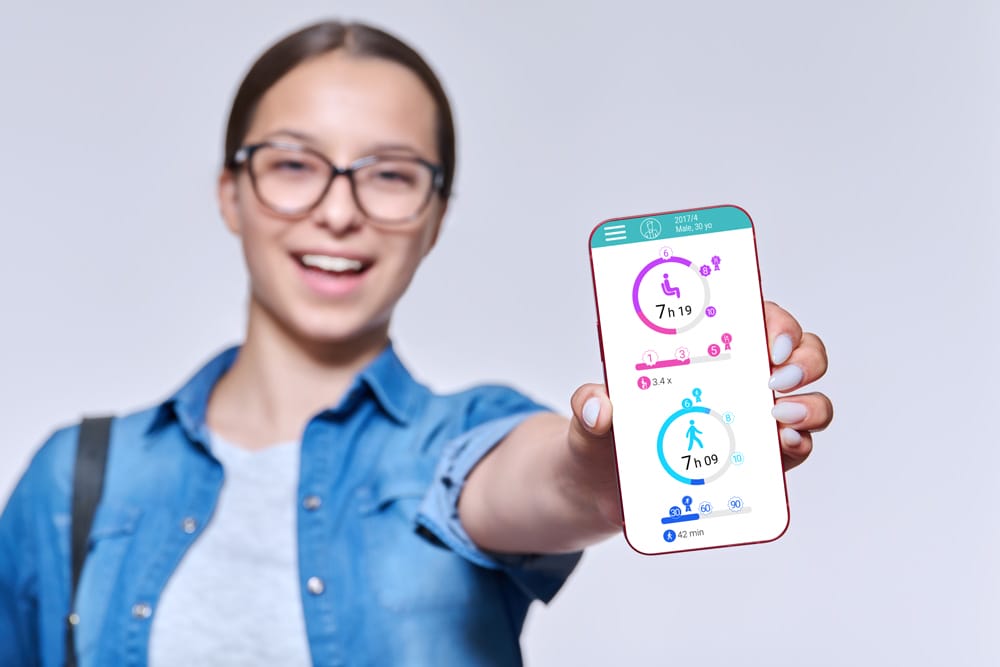
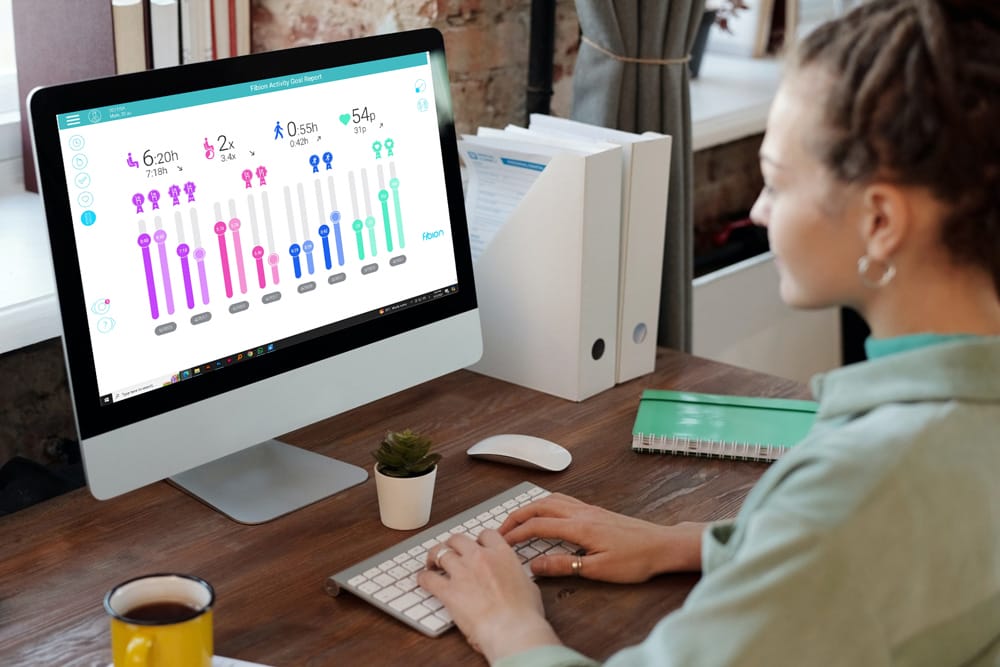
I have very positive experiences about Fibion. The report is good and practical, and customers understand it well when we are going through it in the consultation.

I like how easy it is to use, how small and lightweight it is, and the automated reports.

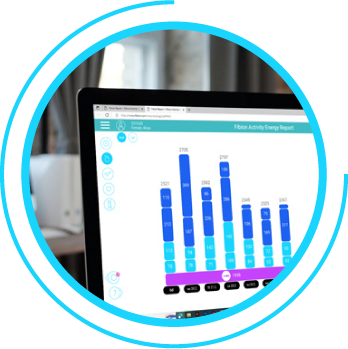
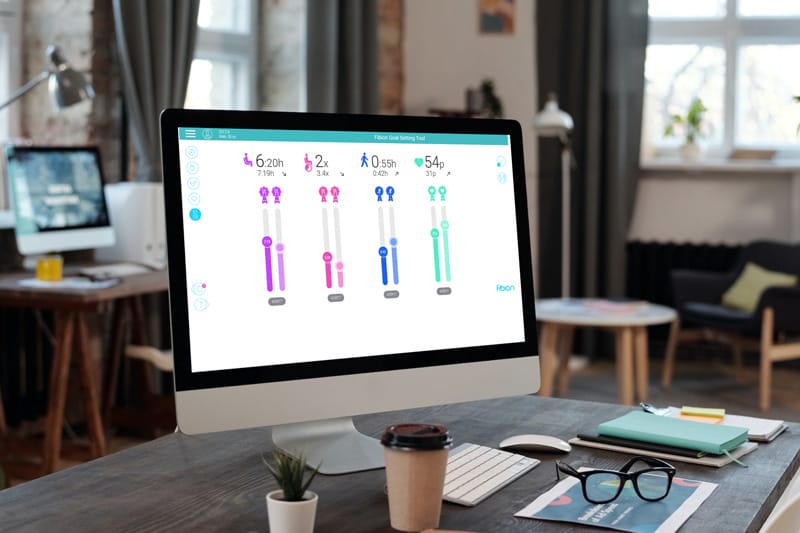
Report is innovative and user-friendly… Interactive report reveals that
measurement data gives insights to several different viewpoints.

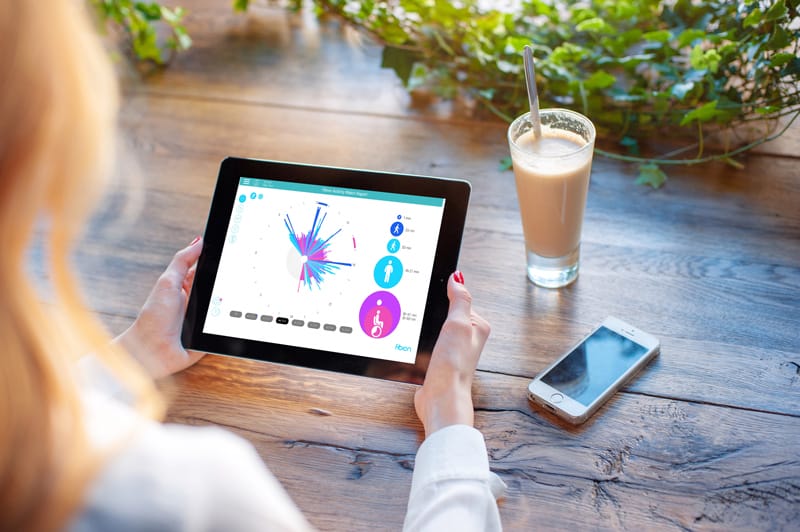
I think the individual day element of the Activity Watch Report is really powerful - I've scared myself by seeing how much time I'm sitting across the day.

Currently I am using Fibion in a project where we investigate activities in daily life in people with lower limb amputation. My impression is that Fibion is easy to implement in this project. It is easy to use and it is also simple to upload and analysis the data.

Enhancing Research and Presentations with Fibion's Group Report Tool
1. Introduction
Fibion has a Report Manager tool that makes it easier to create group reports from...
Simplifying Group Reports Creation for Sedentary Behavior and Physical Activity Presentations
Introduction
In today’s fast-paced research and wellness environments, the ability to quickly generate...
Enhancing Mental Health Research with Fibion Reports
Introduction
In mental health research, it is crucial to explore how sedentary behavior, physical activity,...